Colorful Generative Art With Chaotic Iterated Function Systems
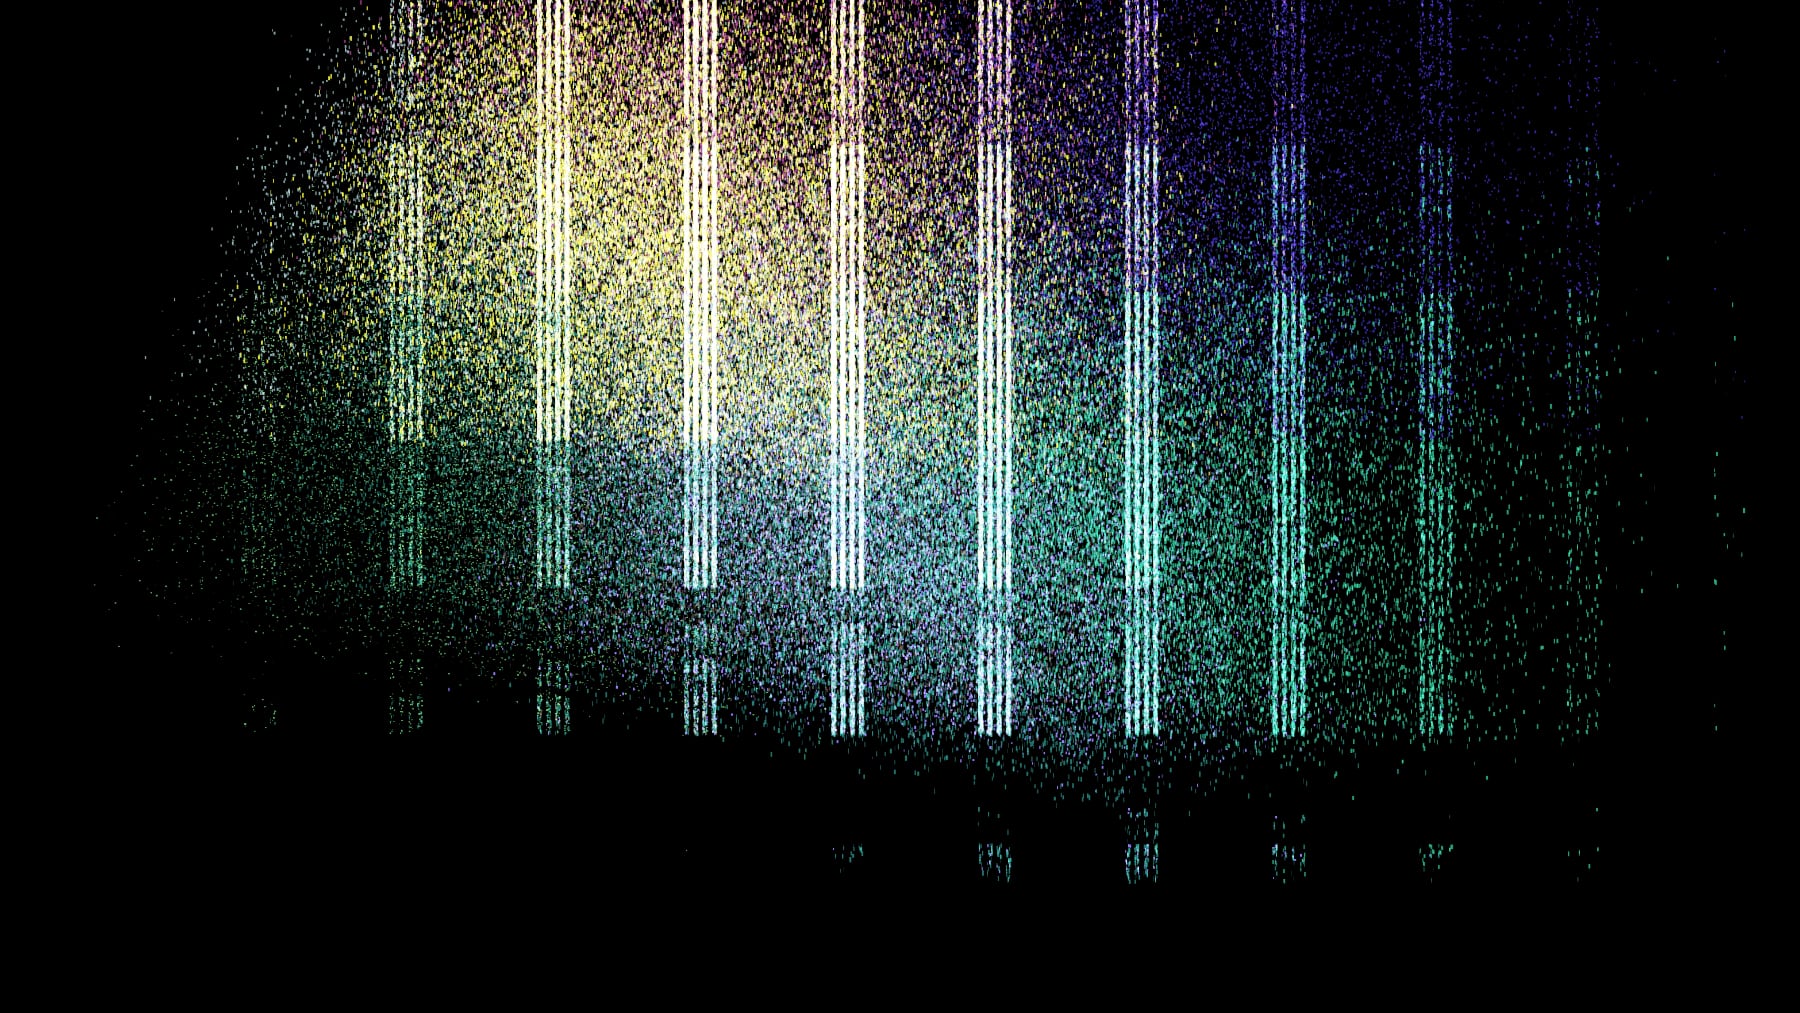
I like to make art in places where people won’t ever see it (in addition to the places where people will see it), a recent one of which is a landing page for some tools1 I’ve built for my own use. The background image on that page is procedurally generated on load, and with a bit of pseudo-random luck, it looks like this:
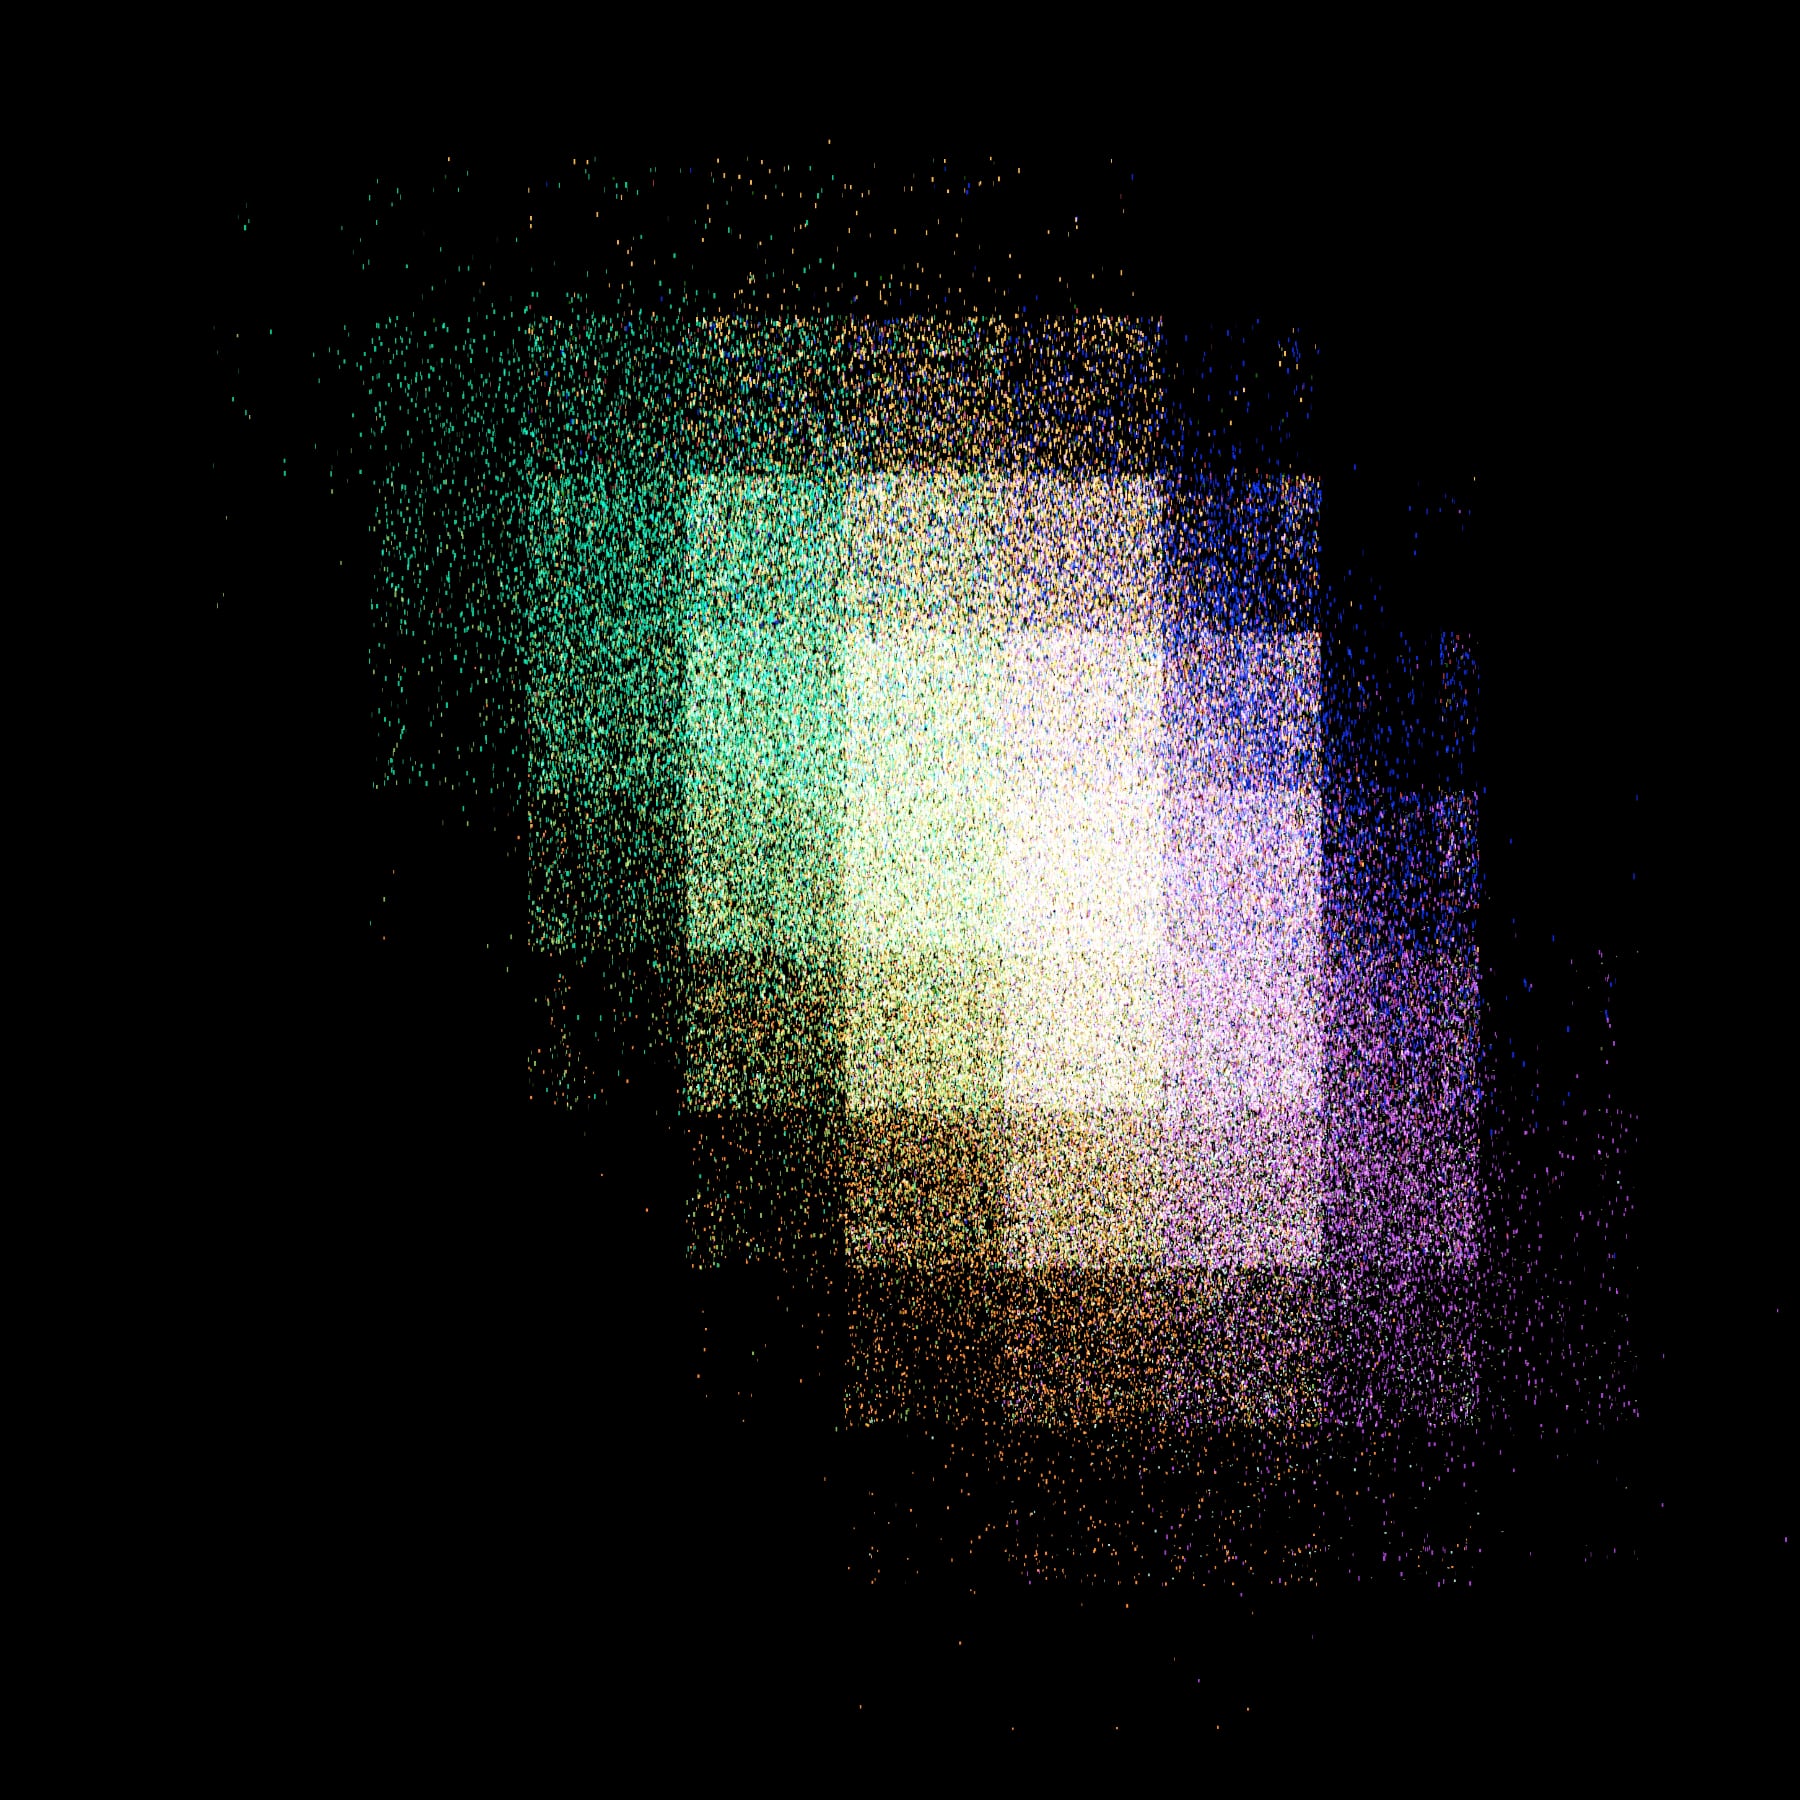
A possible result. There’s also a demo where you can generate your own!
We’ll get to that subtle large-scale pixelation effect later. The rest, i.e., the irregularly-sized elongated grains whose colors tend to vary depending on location, are the result of a fairly basic2 iterated function system (IFS for short).
IFS, WTF?
In a previous post on drawing the Sierpiński triangle using SQL’s WITH RECURSIVE clause, I explained what iterated function systems are with, dare I say, a modicum of mathematical rigor. So, if you find yourself wanting for more than the following hopefully-intuitive description, go read that!
- Essentially, an IFS is a set of functions that can be applied to each other’s outputs in any order and as many times as you like.
- Endless possibilities, right? Let’s constrain things a little.
- Our functions will operate on points in 2D space, each consuming a point and returning a different point. The idea/hope/goal is that when we continuously plot the points returned in each iteration of the IFS, visually interesting behavior will emerge.
- In fact, each function will be coupled to a point . We’ll have a dozen or so of these anchor points (and thus, functions).
- Apart from being associated with different anchors, our functions are almost identical; each function computes a point a certain distance along an imagined line from the input point to the anchor point associated with that function. (If you’d like a visualization of this principle, follow that link. Fair warning: It’ll take you to Twitter.)
More or less clear patterns emerge depending on how the anchor points are situated (three points in a triangle arrangement yield the Sierpiński triangle, for instance – more points allow for less regular structures) and how far along the imagined line the outputs lie (closer to the anchor tends to yield clearer, smaller-scale patterns).
And what about colors? Easy: We’ll associate each function/anchor with a color and always draw3 its output points in that color.
Implementation
Being built to generate the background image of a website on the fly, my implementation is done in JavaScript (just plain JavaScript, no assembly4 required). You shouldn’t have any problem replicating things in another environment, though – we’re not doing anything fancy.
With the end result being a website, we’ll need a bit of HTML5 as scaffolding:
<body style="margin: 0; background: black; height: 100%;">
    <canvas id="art"></canvas>
    <script>
        const canvas = document.getElementById("art");

        // further code snippets go here
    </script>
</body>
With that set up all nicely, we’ll prepare the <canvas> for drawing. Most importantly, we’ve got to make sure to up the resolution for screens running in scaled modes (i.e., in Apple parlance, Retina displays) while keeping the size the same.
// get dimensions of body element
let w = document.body.offsetWidth;
let h = document.body.offsetHeight;

// detect device pixel ratio
let dpr = 1;
if (window.devicePixelRatio) {
    dpr = window.devicePixelRatio;

    // set dimensions of the canvas element to match the body
    canvas.style.width = w + "px";
    canvas.style.height = h + "px";

    // adjust width and height variables according to the detected pixel ratio
    w = w * dpr;
    h = h * dpr;
}

// set drawing dimensions of canvas: if the pixel ratio is 1, this will match
// the size of the canvas element, but if it's higher (common values will be 2
// and 3), the canvas will allow for more detail (matching the physical pixels
// of the device but not the virtual pixels of the page)
canvas.setAttribute("width", w);
canvas.setAttribute("height", h);

// prepare a two-dimensional drawing context
const ctx = canvas.getContext("2d");

// use "screen" blend mode
ctx.globalCompositeOperation = "screen";
The last line’s essential to the final look: Setting globalCompositeOperation = "screen" changes the behavior of all drawing functions to more-or-less add6 the color-to-be-drawn onto any pre-existing color, kind of like using transparent instead of opaque paint – except things get brighter instead of darker when overpainting. You might be familiar with “screen” as a layer blend mode in Photoshop.
We’ll be dealing with pseudo-random numbers a bunch, so let’s define a handy alias for the Math.random() function…
// shortcut for random numbers (0 <= r() < 1)
const r = Math.random;
…and put down some anchors:
// generate anchors
const anchors = [];
for (let n = 0; n < 10 + r() * 10; n++) {

    // bias toward edges
    const x = r() > 0.5 ? r() ** 2 * w : w - r() ** 2 * w;
    const y = r() > 0.5 ? r() ** 2 * h : h - r() ** 2 * h;
    anchors.push([x,y]);
}
There’s a bit more going on here. We create somewhere7 between 10 and 20 anchors, each with an x and a y coordinate. The x coordinate is randomly generated between zero and w, but biased toward either edge of that range by squaring the random number while it’s still in the interval – a trick to decrease the likelihood of all anchors crowding in the middle of the canvas, which would leave us with a small drawing surrounded by a lot of empty space. Same procedure for the y coordinate.
Once finished generating anchors, let’s associate each of them with a randomly-selected color:
// associate each ancor with a color
const colors = anchors.map(() => `rgb(${r()*255},${r()*255},${r()*255})`);
Any valid CSS color would work here, but we’re keeping it basic – just RGB values, each between 0 and 255. As mentioned previously, we’ll use these colors to draw the point computed in each iteration of the IFS depending on the selected anchor.
Apart from the positions of the anchor points, another variable affecting the structure of the final drawing is how close to the anchor to move during each iteration. To achieve some variety in the “image space” of our generator, we’ll randomly pick a step length between, say, a quarter and halfway. We also set an initial point (as input for the first iteration) pretty much arbitrarily in the middle of the canvas.
// determine how close to the anchor to move in each iteration
const step = 0.25 + r() * 0.25;

// set initial point
let p = [w/2, h/2];
If you’ve taken a look at the demo, you will have noticed that the final image doesn’t appear all at once. Its constituent points are drawn over several seconds – that’s for two reasons, namely 1. performance (the sooner something’s on the screen, the better an experience for the viewer) and 2. because it looks neat.
We’ll tackle that part later and just look at the basic algorithm8 for now – here it is:
// iterated function system goes brr
const iterations = w * h / 10;
for (let i = 0; i < iterations; i++) {

    // select anchor and associated color
    const a = Math.floor(r() * anchors.length);
    ctx.fillStyle = colors[a];
    const anchor = anchors[a];

    // compute new point
    const x = (1 - step) * p[0] + step * anchor[0];
    const y = (1 - step) * p[1] + step * anchor[1];
    p = [x,y];

    // draw point as a tiny rectangle (with random size)
    ctx.fillRect(x, y, 0.5 + r() * 1.5 * dpr, r() * 3 + Math.sqrt(a) * dpr);
}
After defining the number of iterations (= the number of points) based on the canvas dimensions, we, well, perform that many iterations. In each iteration, we
- randomly pick an anchor,
- set the drawing context’s
fillStyleto the associated color, - and – depending on the step length – compute a new point through linear interpolation between the previous point and the selected anchor,
- which we then draw.
That’s basically it, providing you with an image a little something like the one at the top of this post! But it’ll take a second or two to appear, and we can’t have that, so let’s draw our image a few iterations at a time9 instead:
// run iterated function system as an animation
let animationFrames = 1500;
let n = 0;
setInterval(() => {

    // decrease drawing rate over time
    let iterations = 2 * (Math.sqrt(w * h) / Math.sqrt(++n)) * (1 - n / animationFrames);
    if (n > animationFrames) return;

    // iterated function system goes brr
    for (let i = 0; i < iterations; i++) {

        // select anchor and associated color
        const a = Math.floor(r() * anchors.length);
        ctx.fillStyle = colors[a];
        const anchor = anchors[a];

        // compute new point
        const x = (1 - step) * p[0] + step * anchor[0];
        const y = (1 - step) * p[1] + step * anchor[1];
        p = [x,y];

        // draw point as a tiny rectangle (with random size)
        ctx.fillRect(x, y, 0.5 + r() * 1.5 * dpr, r() * 3 + Math.sqrt(a) * dpr);

        // also a bit of large-scale pixelation for fun
        if (r() > 0.5) {
            ctx.fillRect((x^(100 * dpr)), (y^(100 * dpr)), 0.5 + r() * 1.5 * dpr, r() * 3 + Math.sqrt(a) * dpr);
        }
    }
}, 1000/60);
My formula for the number of iterations doesn’t have proper mathematical underpinnings – it just kind of results in a pleasing behavior (to me, anyway), drawing lots of points in the beginning and petering out slowly.
At the bottom of that listing, these easy-to-miss lines take care of the “pixelation” effect…
// also a bit of large-scale pixelation for fun
if (r() > 0.5) {
    ctx.fillRect((x^(100 * dpr)), (y^(100 * dpr)), 0.5 + r() * 1.5 * dpr, r() * 3 + Math.sqrt(a) * dpr);
}
…utilizing the bitwise XOR operator in a way I admittedly don’t fully understand, resulting from my playing around with the coordinates until something interesting happened. When making generative art, this kind of “fuck around and find out” strategy works really well for coming up with different riffs on an algorithm, often taking you down paths you wouldn’t have a chance of reasoning your way towards!
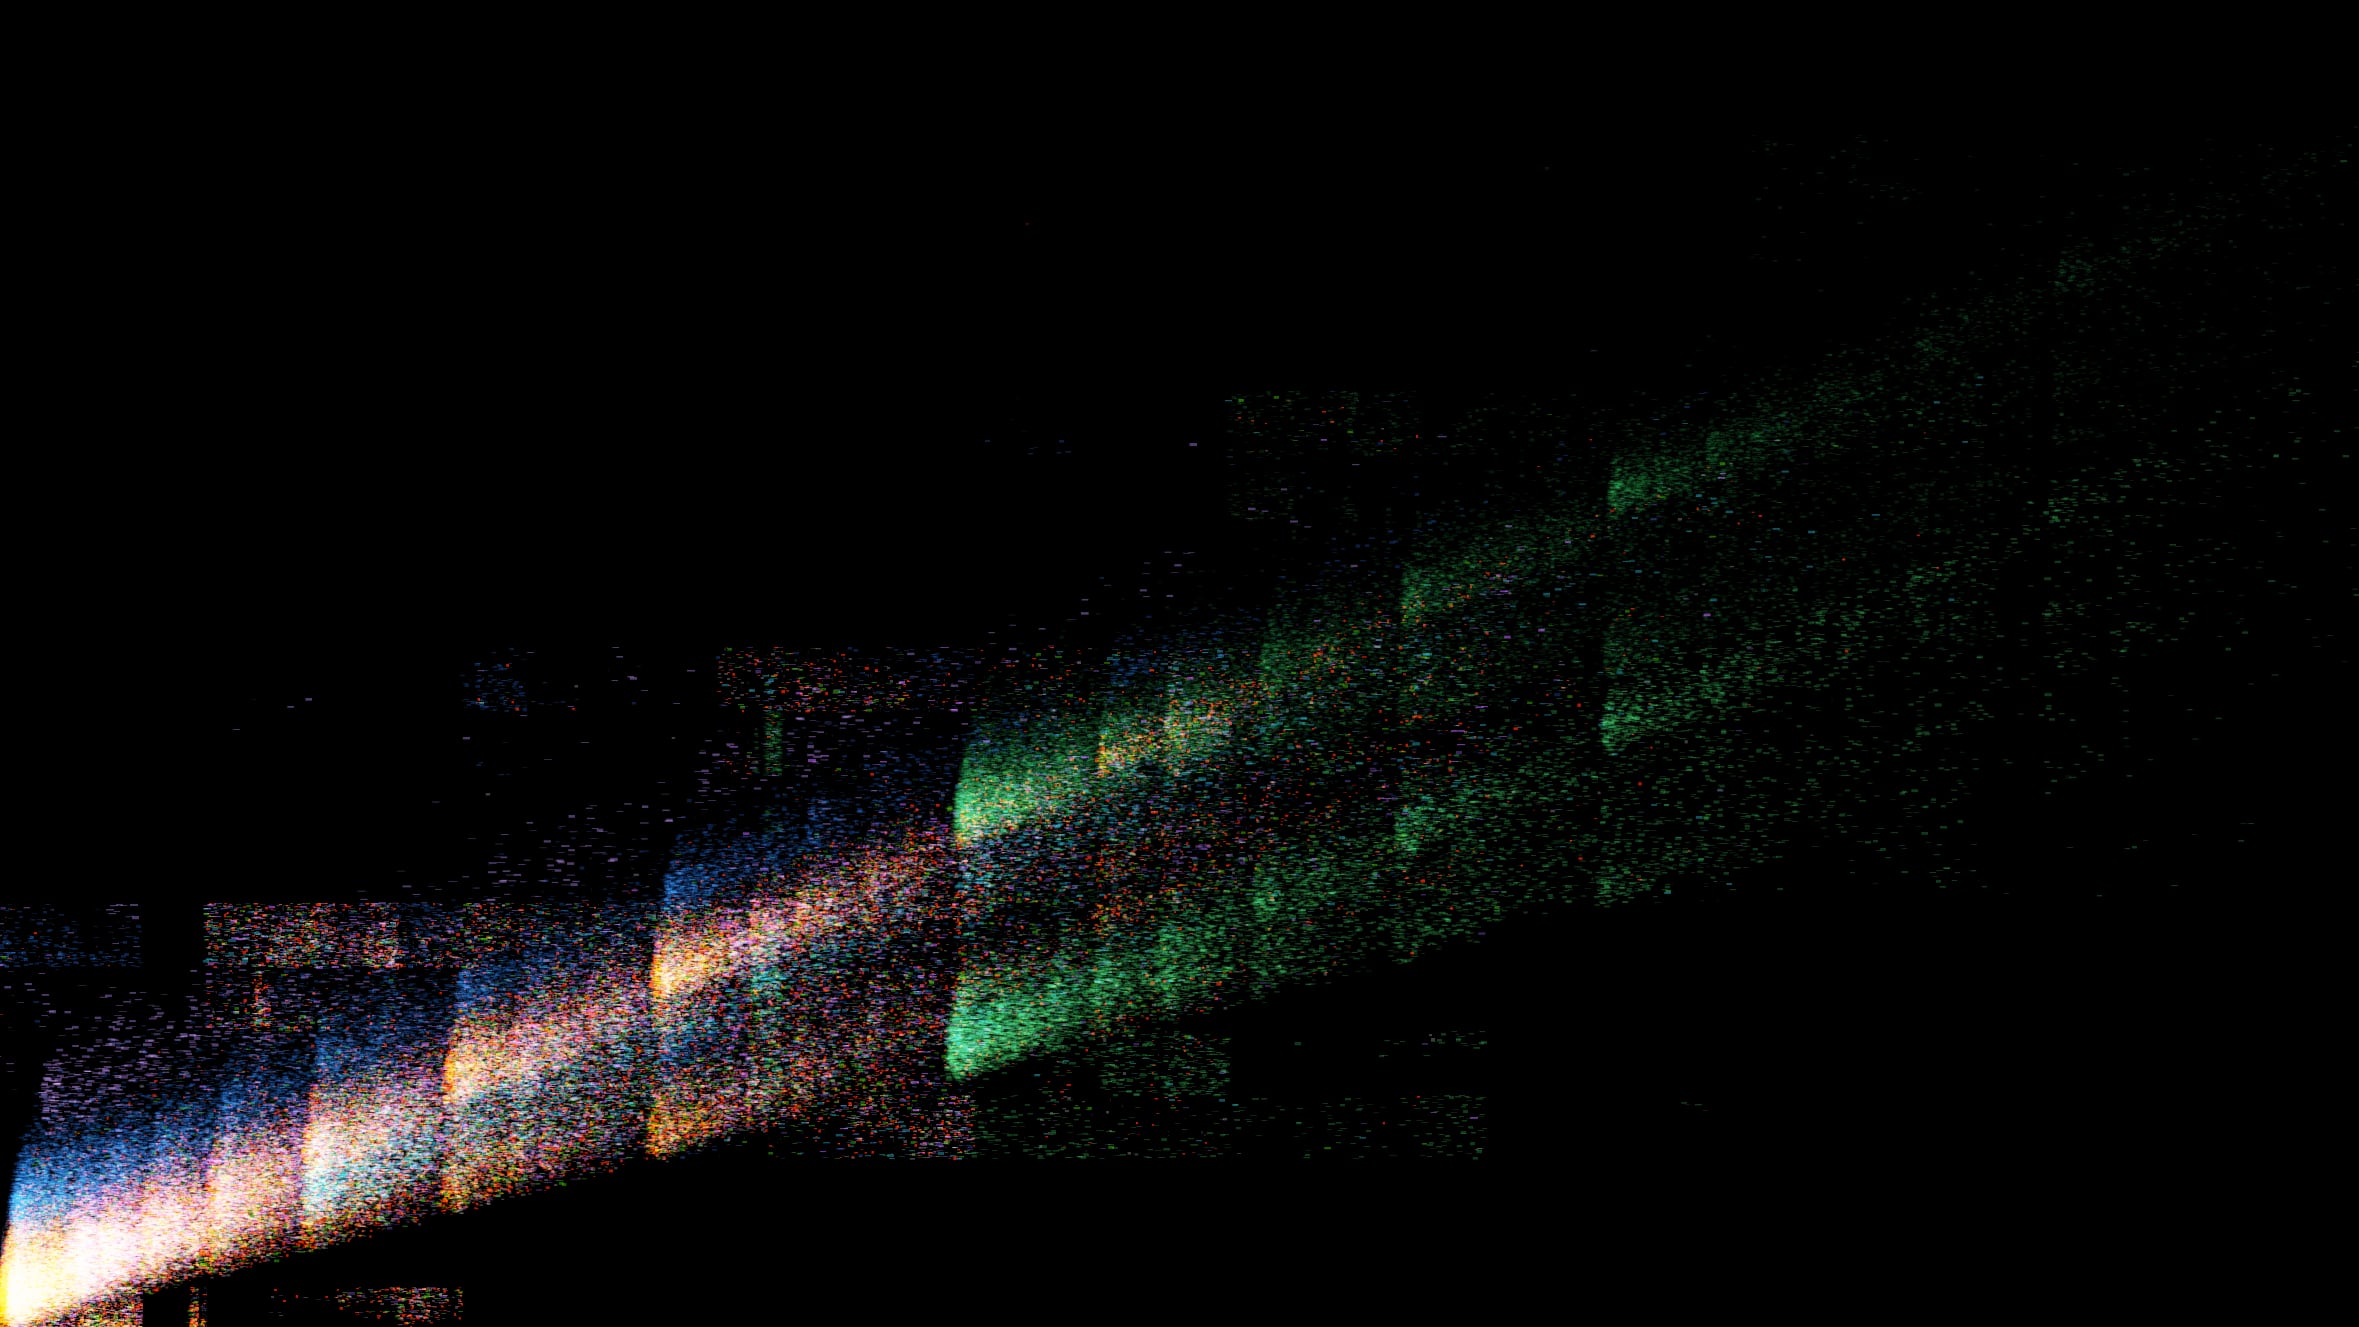
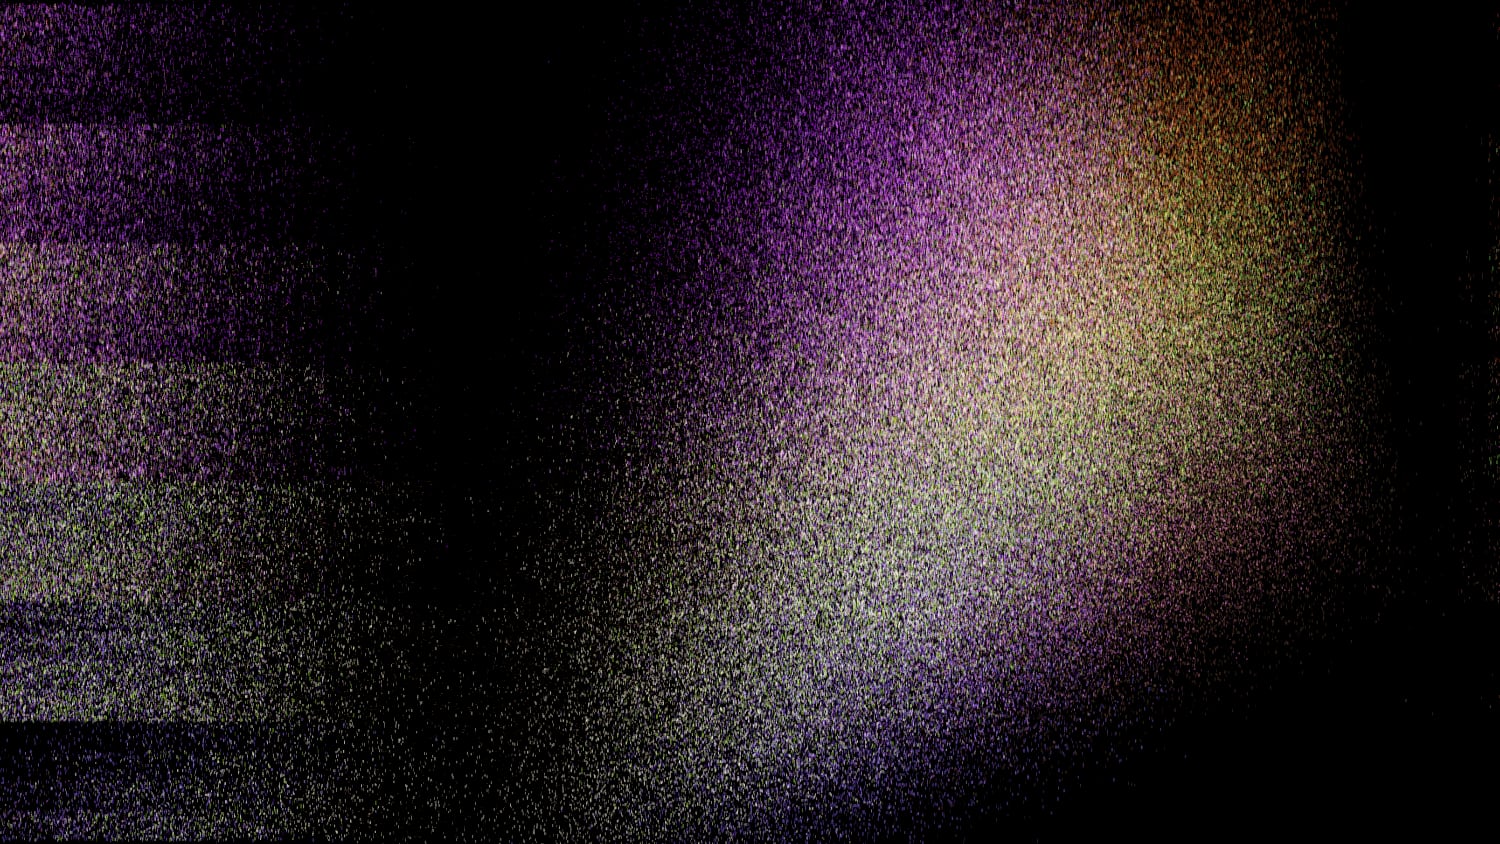
I’ll close this post out with some images made by applying that strategy to the generator we’ve just built. (…in a bit of a half-assed way, taking only a minute each – there’s many more possibilities!)
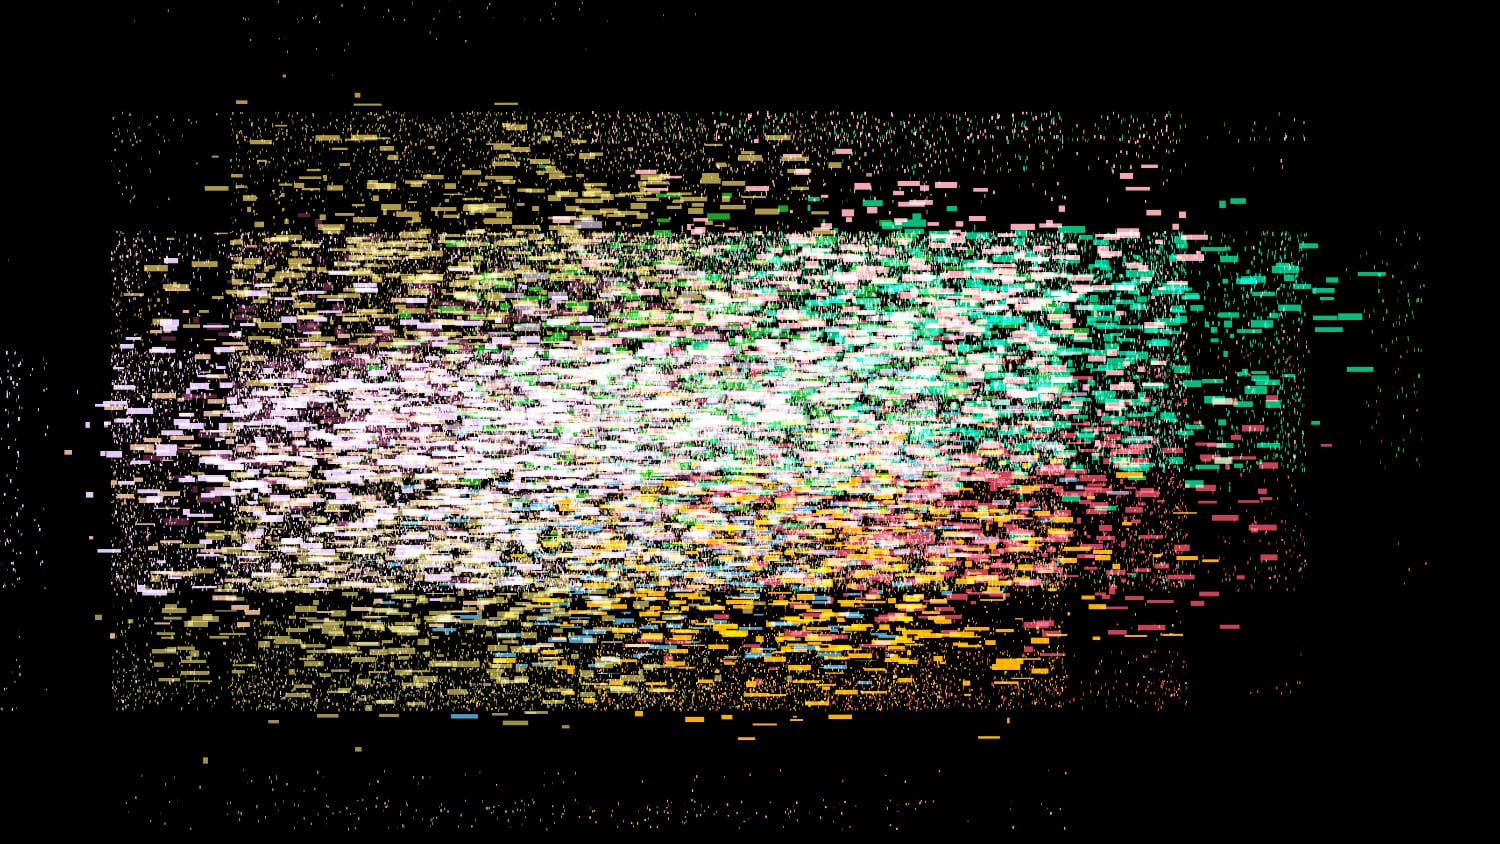
Drawing some points (well, not anymore!) larger than others.
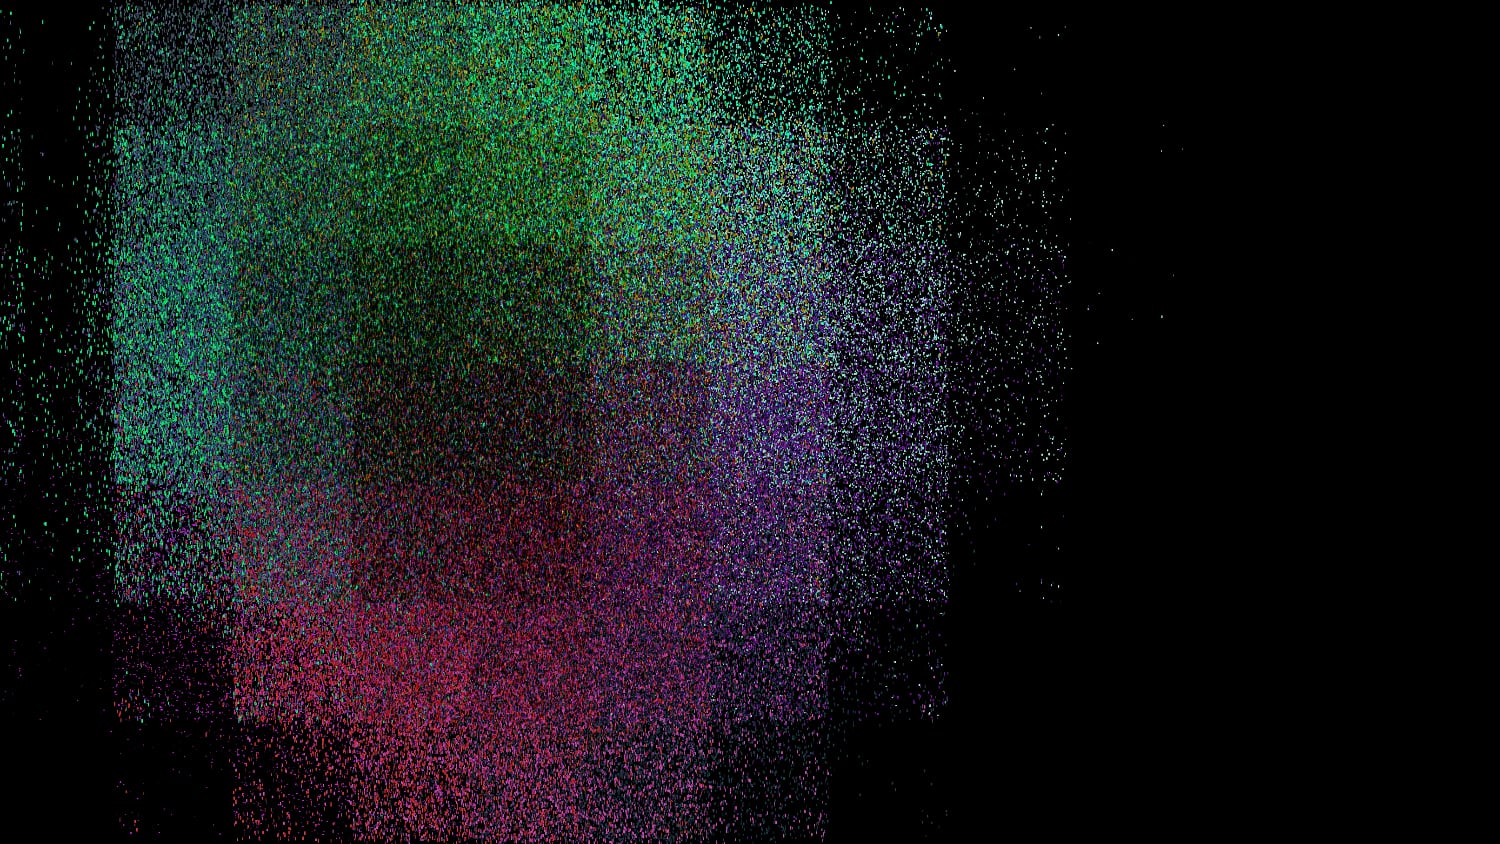
Using the “multiply” blend mode instead of “screen”, yielding a darker area in the middle of the generated blob.
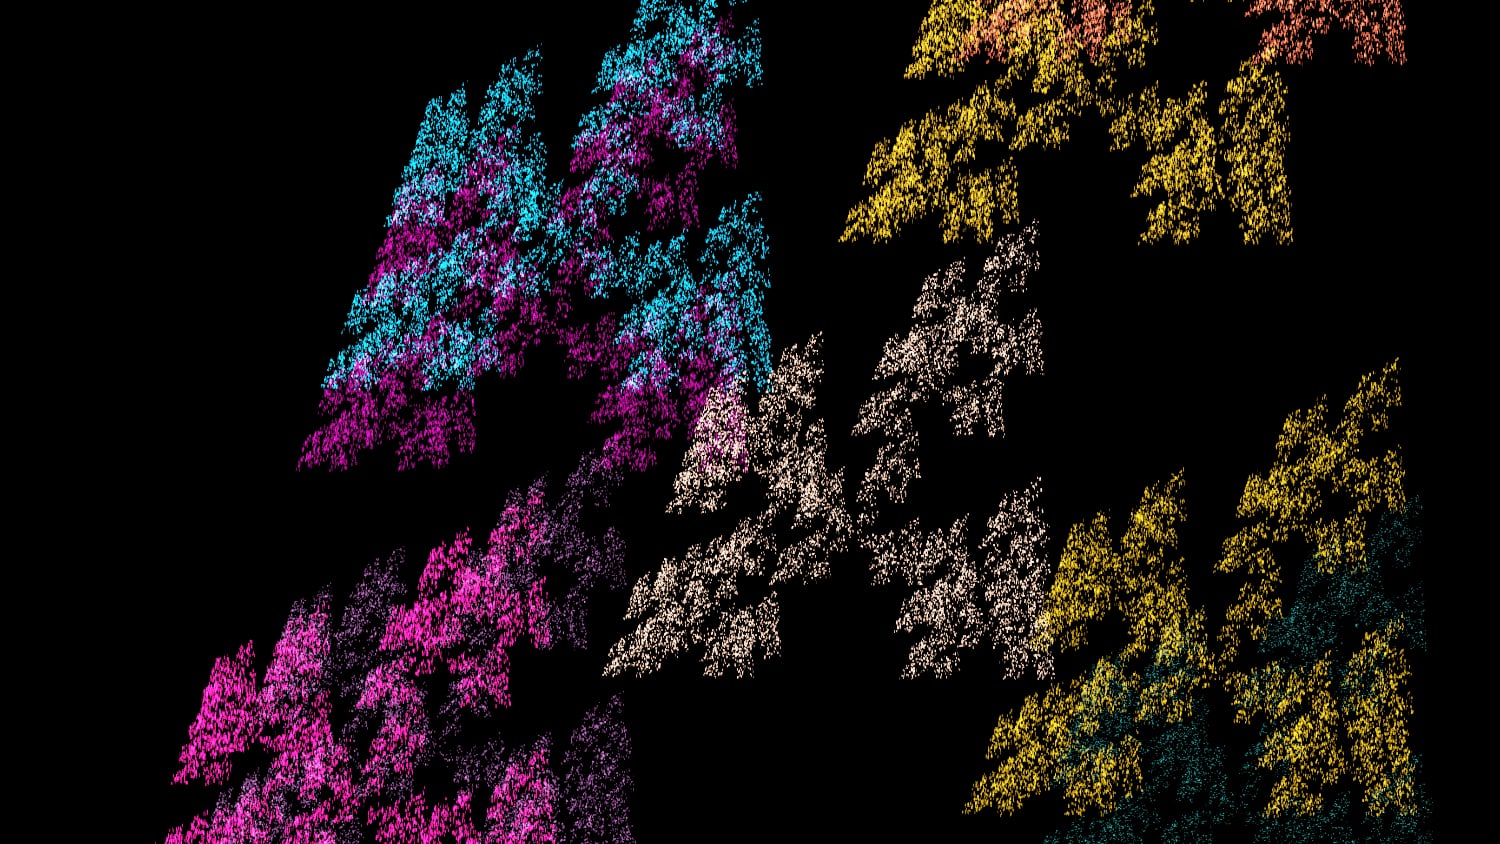
Fewer anchor points, and placing points closer to them in each iteration. Perhaps reminiscent of the layers of a Menger sponge?
Using logical OR instead of XOR on the horizontal coordinate. Glitch art vibes, neat!
Replacing const r = Math.random; with const r = () => Math.random() * Math.random();.
Don’t even remember what I did here.
-
The source code of some of these tools is up on GitHub, e.g., the terrible10 PHP spaghetti code monster that is ReAD, my read-it-later application. ↩
-
Basic indeed – artsy stuff aside, there’s many kinds of real-world structures you can approximate using iterated function systems, e.g., ferns, sponges, or trees. Look at the images in the Wikipedia article for a few examples. ↩
-
I first did that for debugging purposes while writing the previously-mentioned post on generating Sierpiński triangles, but it looked pretty, so I turned it into, well, this. ↩
-
Build steps, type checking, React, or whatever else people do to avoid directly writing JavaScript these days. ↩
-
Lifted straight from an old post of mine on replicating the now-even-more-ancient-than-then Starfield screensaver from the late 90’s. ↩
-
In fact, it’s not straight-up adding – you can learn about the details on Wikipedia. ↩
-
Contrary to what you might intuit, on average this approach yields about 13.6 anchors – that’s because the termination condition is evaluated after each iteration of the loop, breaking out of the loop pretty much as soon as
r()yields a small value. To avoid this (and achieve a linear distribution of possible anchor counts), we could store the result of10 + r() * 10in a variable first and reference that in the loop’s termination condition.Here’s a quick-and-dirty Monte Carlo simulation that demonstrates this behavior:
const runs = 1000;
let avg = 0;
for (let i = 0; i < runs; i++) {
    let n;
    for (n = 0; n < 10 + r() * 10; n++) {
        // do nothing
    }
    avg += n / runs;
}
console.log(avg);
It should print something like
13.675999999999924. ↩ -
If you can call these 10 lines of code an algorithm. But hey, dress for the job you want, right? ↩
-
Instead of using
setInterval(), arequestAnimationFrame()approach would be cleaner, but it introduces just a little bit of complexity that’s not needed here. ↩ -
In my defense, I started building it in 2013, just a few months into properly learning to program. So far, the occasional maintenance/extension work on it has been just about bearable enough to never warrant a full rewrite. And yes, this is a footnote’s footnote. ↩